One of our specialities at Transitiv Technologies is the implementation of custom monitoring plugins for Nagios, Icinga and Icinga 2. As a company built upon Open Source software we feel a duty to contribute back to the community. To show our commitment to this premise we have released a package of plugins under the permissive ISC license.
Download
![]() Latest version: 0.8
Latest version: 0.8
Source installation instructions are contained in the README file
A public source code repository can be found on Github. We welcome bug reports, feature requests and patches.
Current Plugins
check_cisco_fans.pl
This plugin checks (via SNMP) the status of fans on any Cisco devices that support the CISCO-ENVMON-MIB. We have verified that the following devices are supported:- Cisco 2800 series routers
- Cisco 2950 and 2960 switches
- Cisco 3500 and 3800 series switches
- Cisco Catalyst 6500 series switches
check_cisco_load.pl
This plugin checks (via SNMP) the 5 minute, 1 minute and 5 second load averages on any Cisco devices supporting either the CISCO-PROCESS-MIB or the OLD-CISCO-CPU-MIB. Distinct warning and critical thresholds for each of the three load averages are supported and performance data is output that can be used to generate graphs for trend analysis in PNP4Nagios:

check_cisco_psu.pl
This plugin checks (via SNMP) the status of all Power Supply Units (PSUs) on any Cisco devices supporting the CISCO-ENVMON-MIB.
check_cisco_temperatures.pl

check_cisco_memory.pl
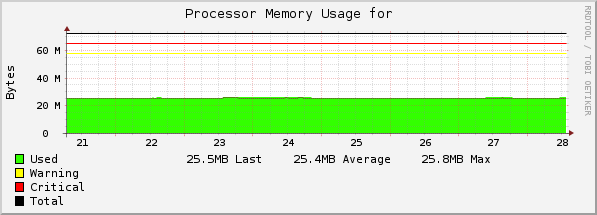
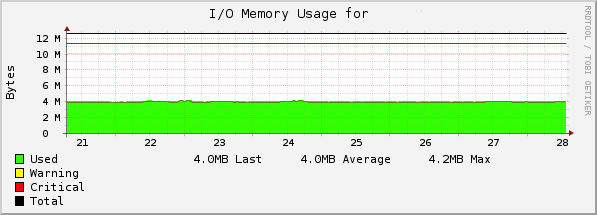
This plugin checks the memory usage of all memory pools on Cisco devices supporting the CISCO-MEMORY-POOL-MIB. Performance data is output for each memory pool and the PNP4Nagios graph template will dynamically display individual graphs for each pool:
check_snmp_printer.pl
check_snmp_uptime.pl
check_wordpress.pl
This plugin fetches a page from a website running on WordPress, determines the installed version via the generator meta tag and then checks this against the WordPress API to ensure it is current. New versions of WordPress often contain important security fixes so we use this plugin at Transitiv to monitor customer sites and alert us as and when they need upgrading.
check_snmp_interface.pl
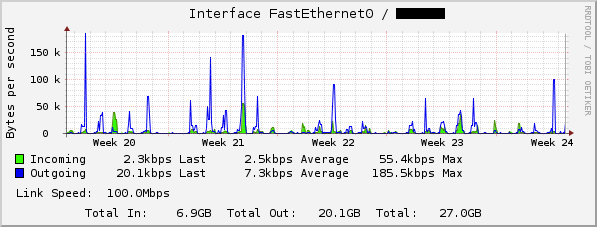
This plugin checks the status of a network interface via SNMP. Bandwidth graphs can be generated using the performance data output.
check_apcupsd_ups.pl
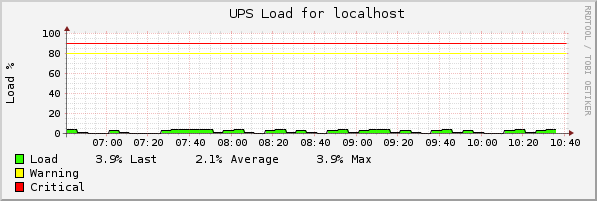
This plugin checks the status of a UPS using apcupsd. Alerts are also generated if the load on the UPS exceeds that defined by the supplied warning and critical arguments. Performance data is returned for a number of attributes including load, line voltage, battery charge, output voltage, internal temperature and battery voltage.
check_linux_memory.pl
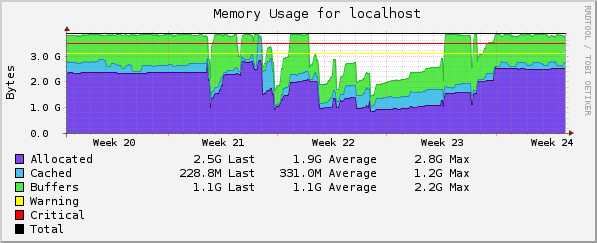
This is a simple plugin that checks the amount of physical memory available to applications on Linux systems. Performance data is included for graphing purposes.
